API Reference:
qbraid.visualization
Draw Circuit Diagrams
qBraid’scircuit_drawer function takes in any type of supported quantum circuit and draws the corresponding visualization.
Here’s an example using braket and cirq:
Draw OpenQASM 3 circuits
Thecircuit_drawer function accepts a string of OpenQASM 3 code and returns a matplotlib figure of the circuit:
pyqasm.draw(..., output="mpl")
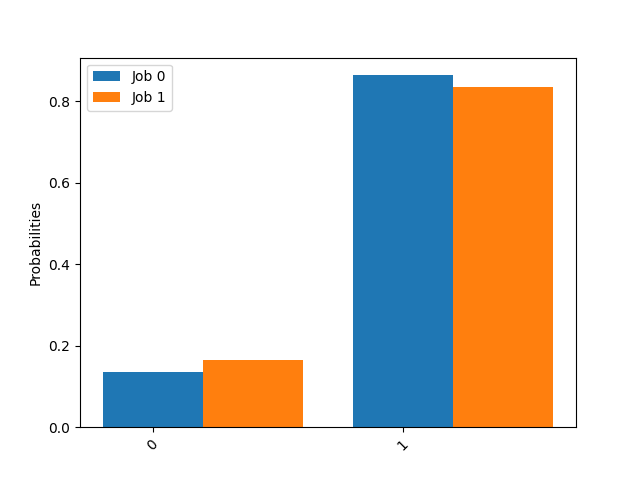
Plot Experimental Results
Gather the measurement counts and plot the histogram data for anyResult constructed from ResultData of type qbraid.runtime.GateModelResultData:
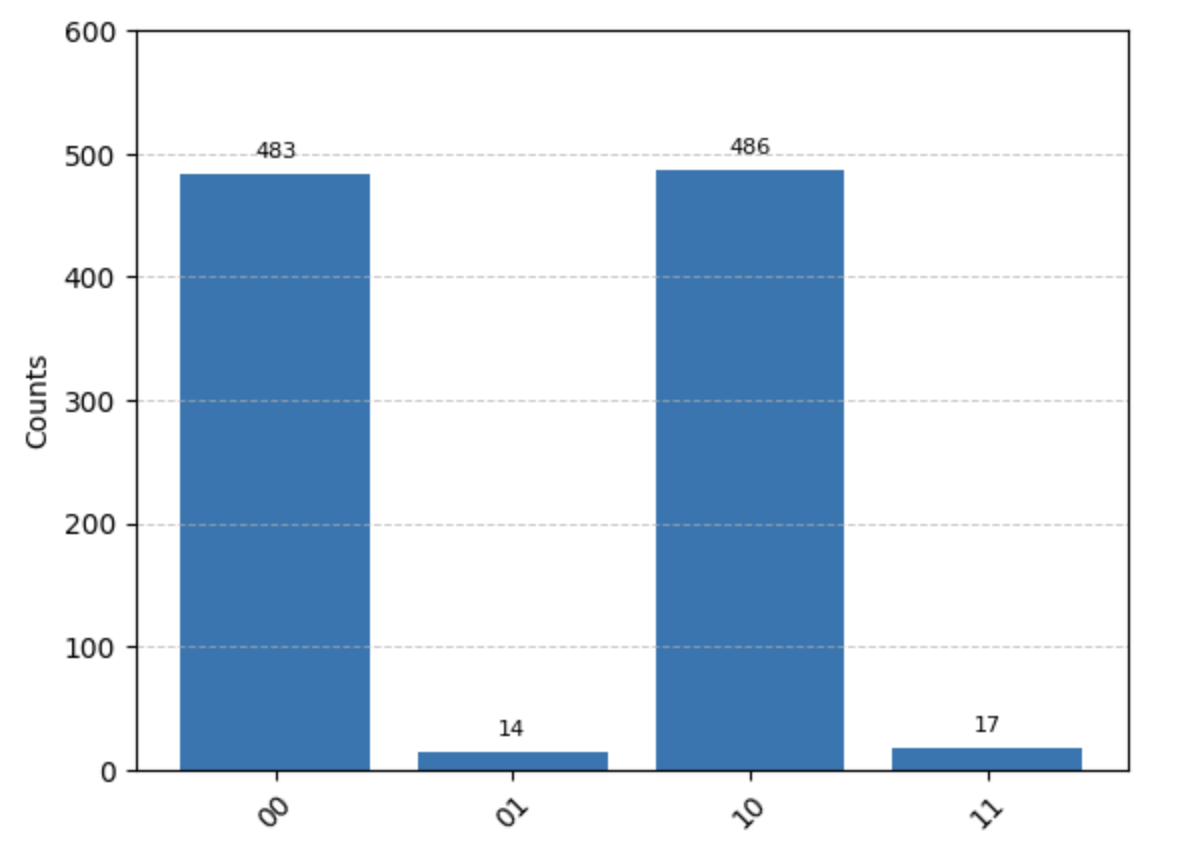
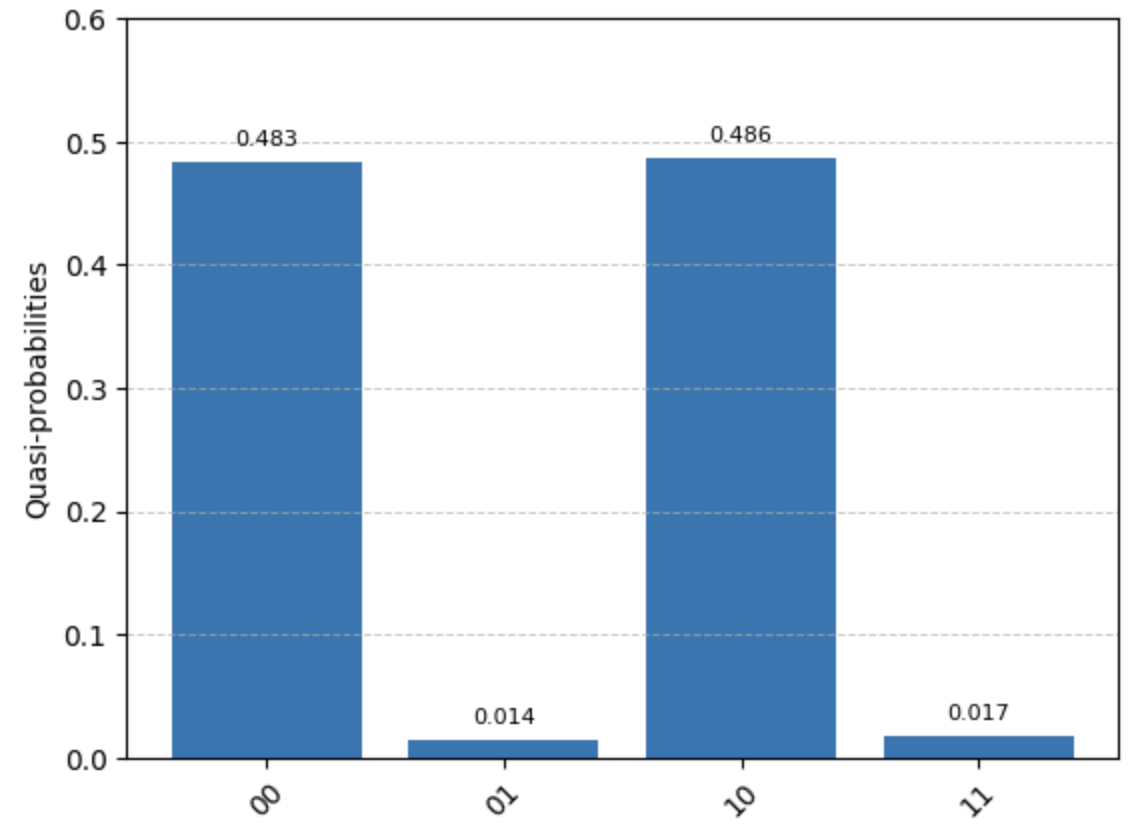
list[qbraid.runtime.GateModeResultData]:
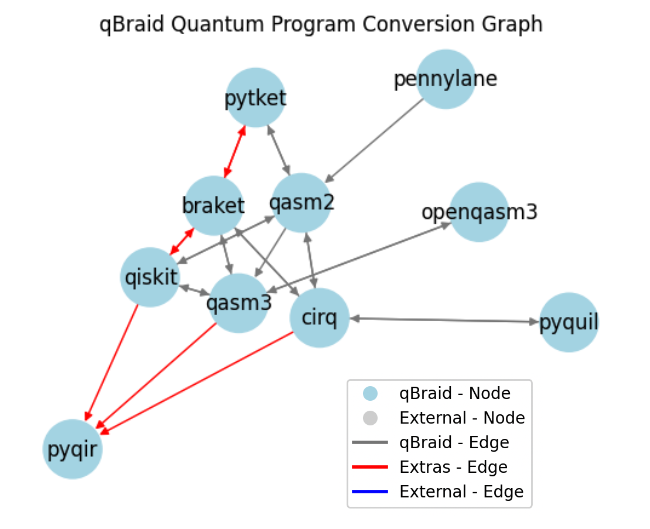
Plot Transpiler Conversions
Plot all supported conversions between registered program types available through theqbraid.transpiler:
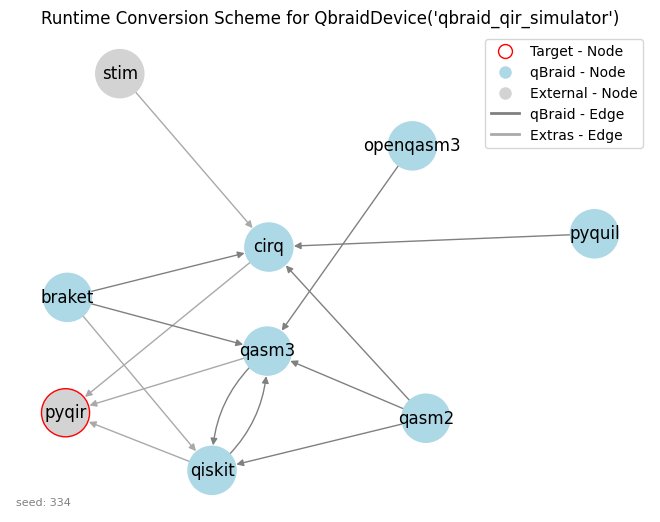
Plot Runtime Conversion Scheme
Plot the runtime conversion scheme for anyqbraid.runtime.QuantumDevice.
The QuantumDevice.scheme defines the qbraid.transpiler.ConversionScheme that will be used to carry out the “transpile” step of the Quantum Job Submission Process.
ConversionGraph includes only program types (nodes) that are directly connected to the target program type by a single conversion step (edge).
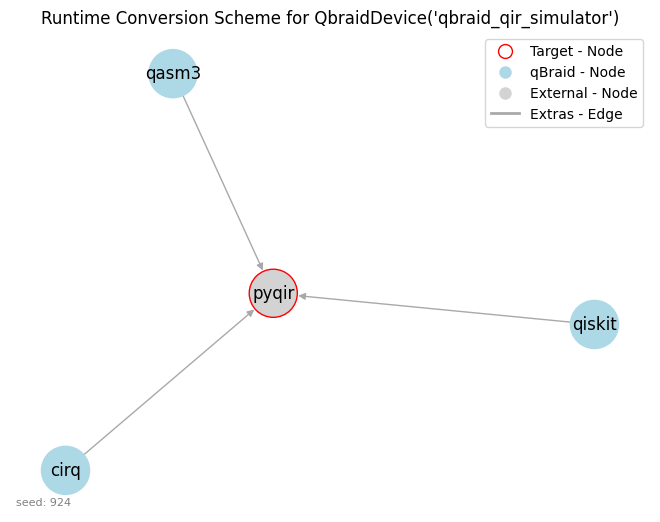
ConversionGraph is expanded to include program types (nodes) that are at most two conversion steps (edges) away from the target program type.