> ## Documentation Index
> Fetch the complete documentation index at: https://docs.qbraid.com/llms.txt
> Use this file to discover all available pages before exploring further.
# Device calibrations and connectivity
> Fetch live coupling maps and calibration data for QPUs on qBraid, plot connectivity graphs, and use the data to place circuits on the best-calibrated qubits before submitting.
Requires the latest `qbraid` pre-release: `pip install --upgrade --pre
qbraid`. Calibration data is refreshed from each hardware provider roughly
hourly.
Superconducting QPUs are not uniform: qubits differ in readout fidelity, and
two-qubit gates only exist between physically coupled pairs, each with its own
error rate. The [QbraidProvider](/v2/sdk/user-guide/providers/native) exposes
both facts programmatically, so you can inspect a device before you submit to
it, and place your circuit on the qubits where it will perform best.
## Fetching calibration data
Every `QbraidDevice` has two entry points:
```python theme={null}
from qbraid.runtime import QbraidProvider
provider = QbraidProvider()
device = provider.get_device("rigetti:rigetti:qpu:cepheus-1-108q")
device.coupling_map
# ((0, 1), (0, 9), (1, 2), (1, 10), (2, 3), ...) 193 physical qubit pairs
calibration = device.get_calibrations()
calibration.last_calibrated
# '2026-07-21T20:05:45+00:00'
```
`coupling_map` is the device's physical connectivity: sorted, deduplicated
`(source, target)` qubit pairs, derived from the calibrated two-qubit gate
edges. It is cached on the device instance, since hardware topology does not
change between calibrations.
`get_calibrations()` returns the full live snapshot and always fetches fresh
data. The two most useful fields:
```python theme={null}
# Per-edge two-qubit gate error, keyed by gate name
calibration.edges["gateError"]["cz"][0]
# EdgeEntry(source=0, target=1, value=0.0246)
# Per-qubit metrics
calibration.qubits["0"]
# QubitCalibration(readout_error=0.04, gate_error={'rb': 0.0019}, ...)
```
Both return `None` for devices without published calibration data, such as
simulators.
### Devices with calibration data
| Physical device | Qubits | Edges | Example device IDs |
| ---------------------- | ------ | ----- | ---------------------------------------------------------------------- |
| Rigetti Cepheus-1-108Q | 107 | 193 | `rigetti:rigetti:qpu:cepheus-1-108q`, `aws:rigetti:qpu:cepheus-1-108q` |
| IQM Garnet | 20 | 30 | `aws:iqm:qpu:garnet` |
| IQM Emerald | 54 | 85 | `aws:iqm:qpu:emerald` |
| AQT Ibex-Q1 | 12 | 0 | `aws:aqt:qpu:ibex-q1` |
All device IDs that map to the same physical hardware share one calibration
snapshot, so `rigetti:rigetti:qpu:cepheus-1-108q` and
`aws:rigetti:qpu:cepheus-1-108q` return identical data.
A device can have calibration data with an empty edge list. AQT's Ibex-Q1 is a
trapped-ion system with all-to-all connectivity, so there are no discrete
coupling edges to report: `coupling_map` returns an empty tuple, not `None`.
For IonQ trapped-ion devices, see `device.profile.characterization` instead.
You can also query the underlying REST endpoint directly, which works for any
device ID including those not available for direct submission:
```bash theme={null}
curl -H "X-API-Key: $QBRAID_API_KEY" \
https://api.qbraid.com/api/v1/devices/rigetti:rigetti:qpu:cepheus-1-108q/calibrations
```
## Plotting the connectivity graph
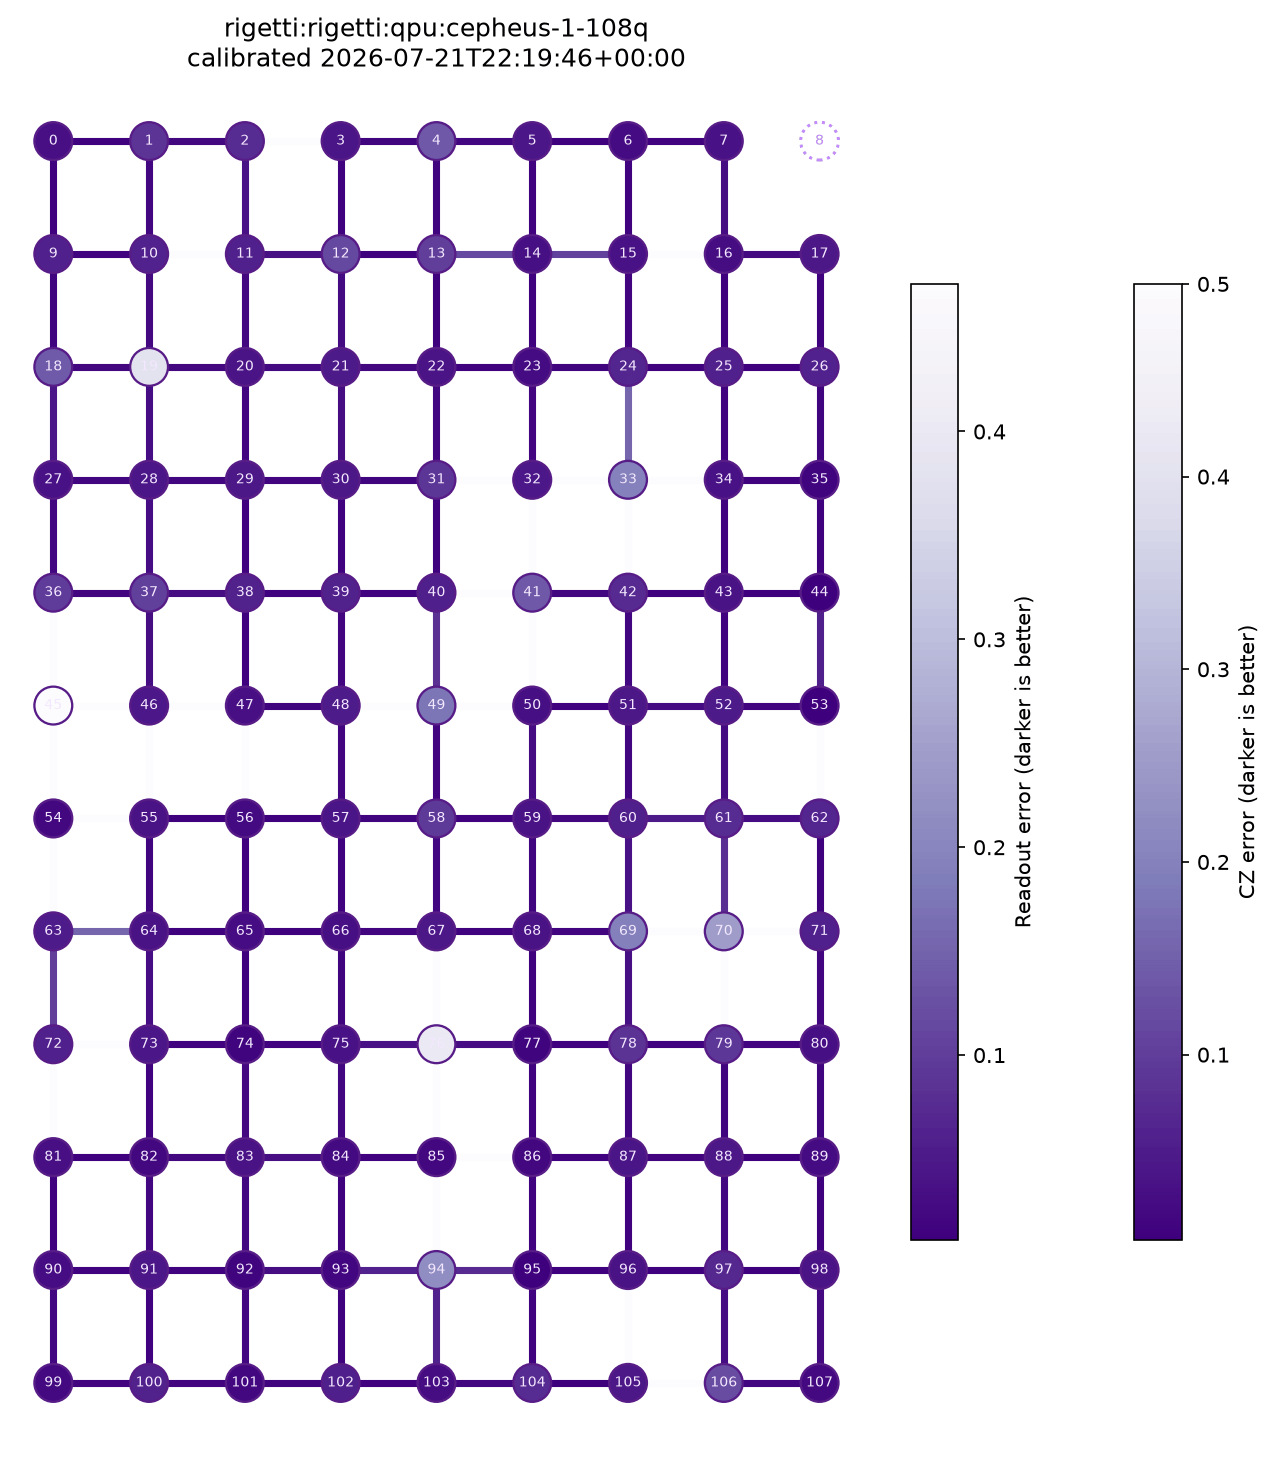
The `qbraid.visualization` module renders the graph in one call, colored by
live calibration data. Edges are colored by two-qubit gate error and nodes by
readout error, on a single-hue scale where darker is better, matching the
topology view in qBraid Lab:
```python theme={null}
from qbraid.visualization import plot_connectivity_graph
plot_connectivity_graph(device)
```
The dotted outline is a qubit in the lattice footprint with no working
couplings. Light qubits and edges are the ones to avoid.
The layout comes from the device document's `topology` config, so square
lattices (Rigetti) and clipped lattices (IQM) both render their true physical
geometry; devices without a lattice config fall back to a force-directed
layout. To build a custom plot, the `lattice_positions` helper maps qubit ids
to grid coordinates from the same config:
```python theme={null}
from qbraid.visualization import lattice_positions
topology = device.client.get_device(device.id).topology
# {'type': 'square-lattice', 'rows': 12, 'cols': 9}
positions = lattice_positions(topology, range(108))
# {0: (0, 0), 1: (1, 0), ..., 107: (8, -11)}
```
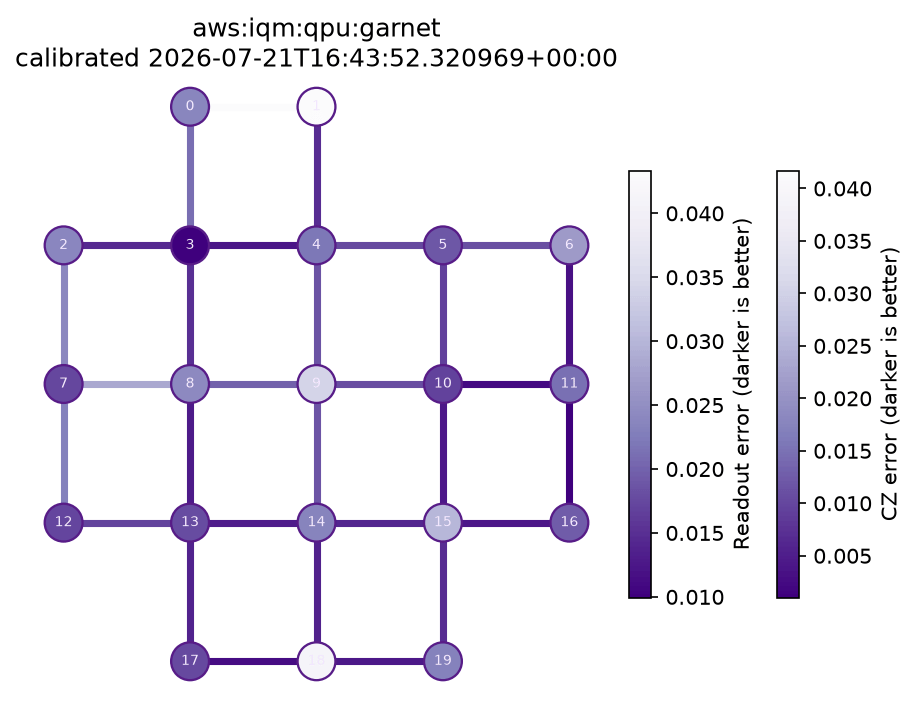
The same call works unchanged on any device with calibration data. IQM's
Garnet renders its clipped diamond lattice:
```python theme={null}
garnet = provider.get_device("aws:iqm:qpu:garnet")
plot_connectivity_graph(garnet)
```
## Choosing the best qubits
With the calibration data in hand, qubit selection becomes a graph problem.
Build a weighted graph from the coupling map, then the single best-calibrated
pair is one line:
```python theme={null}
import networkx as nx
calibration = device.get_calibrations()
edge_error = {
(e.source, e.target): e.value
for e in calibration.edges["gateError"]["cz"]
}
graph = nx.Graph()
for q0, q1 in device.coupling_map:
graph.add_edge(q0, q1, error=edge_error.get((q0, q1), edge_error.get((q1, q0))))
```
```python theme={null}
best_edge = min(edge_error, key=edge_error.get)
# (88, 89), CZ error 0.0037 -- 2.3x better than the device median
```
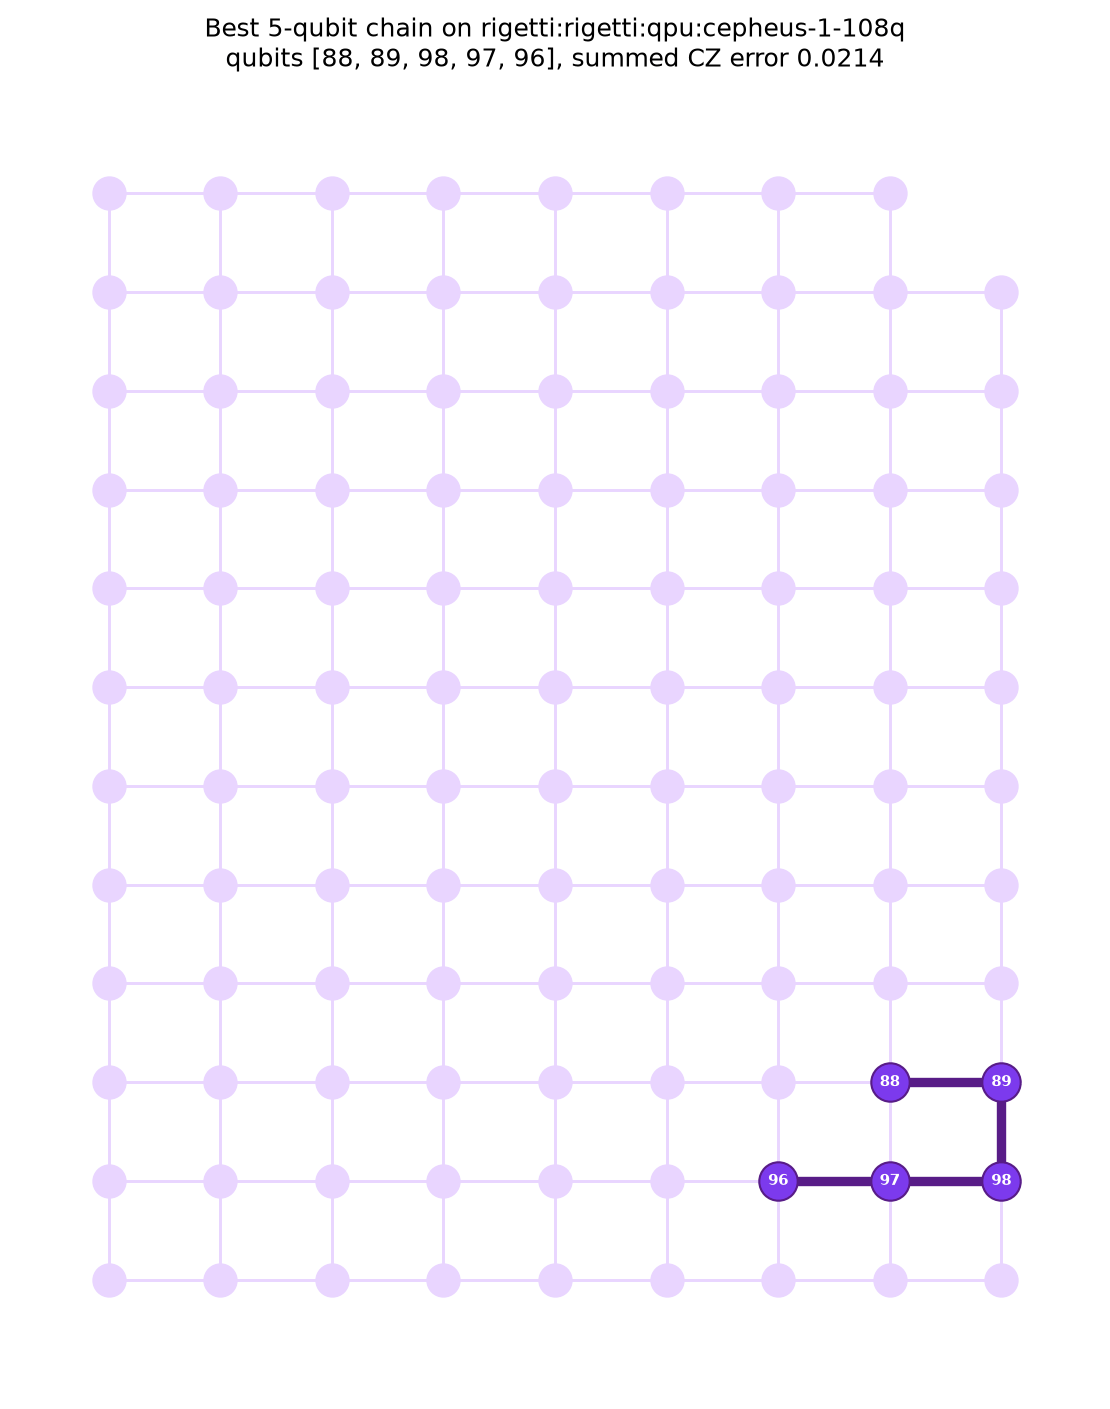
For a linear circuit on `n` qubits, search for the connected chain that
minimizes the summed two-qubit error:
```python theme={null}
def best_chain(graph, length):
"""Find the simple path of `length` qubits minimizing summed edge error."""
best = (float("inf"), None)
def extend(path, total):
nonlocal best
if total >= best[0]:
return
if len(path) == length:
best = (total, list(path))
return
for nbr in graph.neighbors(path[-1]):
if nbr not in path:
path.append(nbr)
extend(path, total + graph.edges[path[-2], nbr]["error"])
path.pop()
for start in graph.nodes:
extend([start], 0.0)
return best
total, chain = best_chain(graph, 5)
# chain = [88, 89, 98, 97, 96], summed CZ error 0.0214
```
Calibrations shift with every refresh, so re-run the selection shortly before
you submit. The best chain this hour is not always the best chain tonight.
## Running on the qubits you chose
### Rigetti direct: hand-placed native gates
On the [Rigetti direct path](/v2/sdk/user-guide/providers/native/rigetti),
programs that bypass quilc must already use
[native gates](/v2/sdk/user-guide/providers/native/rigetti#native-gates) on
physical qubits, which is exactly what the coupling map enables. A Bell pair
on the best-calibrated edge:
```python theme={null}
import pyquil
q0, q1 = best_edge # (88, 89)
program = pyquil.Program(f"""
DECLARE ro BIT[2]
RX(pi/2) {q0}
RX(pi/2) {q1}
CZ {q0} {q1}
RX(-pi/2) {q1}
MEASURE {q0} ro[0]
MEASURE {q1} ro[1]
""")
job = device.run(program, shots=100)
job.wait_for_final_state()
job.result().data.get_counts()
# {'00': 44, '11': 44, '01': 7, '10': 5} -- run on Cepheus-1-108Q, 2026-07-21
```
The correlated outcomes (`00` and `11`) came back at 88 percent on hardware,
consistent with the roughly 0.4 percent CZ error and few-percent readout error
of the chosen pair.
### Qiskit: constrain transpilation to the real topology
If you would rather let a transpiler do the routing, feed the coupling map to
Qiskit and pin your circuit to the chain you selected. This works for any
gate-model device on qBraid:
```python theme={null}
from qiskit import QuantumCircuit, transpile
from qiskit.transpiler import CouplingMap
ghz = QuantumCircuit(5, 5)
ghz.h(0)
for i in range(4):
ghz.cx(i, i + 1)
ghz.measure(range(5), range(5))
coupling = CouplingMap(
[list(edge) for edge in garnet.coupling_map]
+ [[b, a] for a, b in garnet.coupling_map]
)
total, chain = best_chain(garnet_graph, 5) # [6, 11, 16, 15, 10] on Garnet
transpiled = transpile(
ghz,
coupling_map=coupling,
initial_layout=chain,
basis_gates=["r", "cz"],
optimization_level=3,
)
job = garnet.run(transpiled, shots=1000)
```
Every two-qubit gate in the transpiled circuit now acts on a physically
coupled, well-calibrated pair, and no SWAP overhead is silently inserted for
qubits you did not choose.
Transpile against the coupling map of the exact device ID you will submit to.
Vendor-routed and direct device IDs share hardware and calibrations, but a
circuit laid out for one device will not fit another.
## Related links
* [QbraidProvider](/v2/sdk/user-guide/providers/native): setup and credentials
* [Rigetti Cepheus-1-108Q](/v2/sdk/user-guide/providers/native/rigetti): native
gates, Quil-T timing, and the two compilation paths
* [Job execution](/v2/sdk/user-guide/providers/native/jobs): single, batch, and
group submission
* [Visualization](/v2/sdk/user-guide/visualization): histograms and other
built-in plotting utilities